Layouts & plotting
Model space, sheets, viewports and viewport scale, page setups, plot style tables, and plotting to PDF at true paper size.
Model space and paper space#
- Model space is the infinite, 1:1 world where the design happens.
- A layout, or paper space, is a physical sheet — Arch D 24×36, A1, Letter — with its own geometry: title block, notes, schedules.
- A viewport entity is a window drawn in paper space that looks into model space. It has a boundary, a model-space target, and a scale factor: 1/4" = 1'-0", which is 1:48.
Sheet tabs#
Sheet tabs run along the foot of the drawing pane: Model first, then every sheet in the order it was made, with a + that adds one.
- Clicking a tab makes that space current.
- Double-clicking renames it.
- Right-clicking offers Rename, New sheet, Delete, Page setup and Plot.
Deleting a sheet is undoable.
A sheet looks like paper#
The page is drawn with its edge, a drop shadow, and a dashed printable-area margin — because a plain white rectangle tells a drafter the paper's edge is the limit, and a title block laid against it plots cropped.
Two things are suppressed on a sheet: the model grid, which is spaced in model units and would be a lattice about nothing on a sheet measured in inches; and the model's UCS icon, which would assert an origin that is not the sheet's. The grid setting is untouched — a view that suppresses is not a view that changes the state it suppresses, or you go back to the model and find the grid off.
Paper space has its own origin icon, drawn as a right triangle so the two are separable at a glance without reading labels. One setting governs both icons, because "show me where the origin is" is one preference.
Geometry on the paper takes the paper's ink — see ByBackground in Layers, blocks & references.
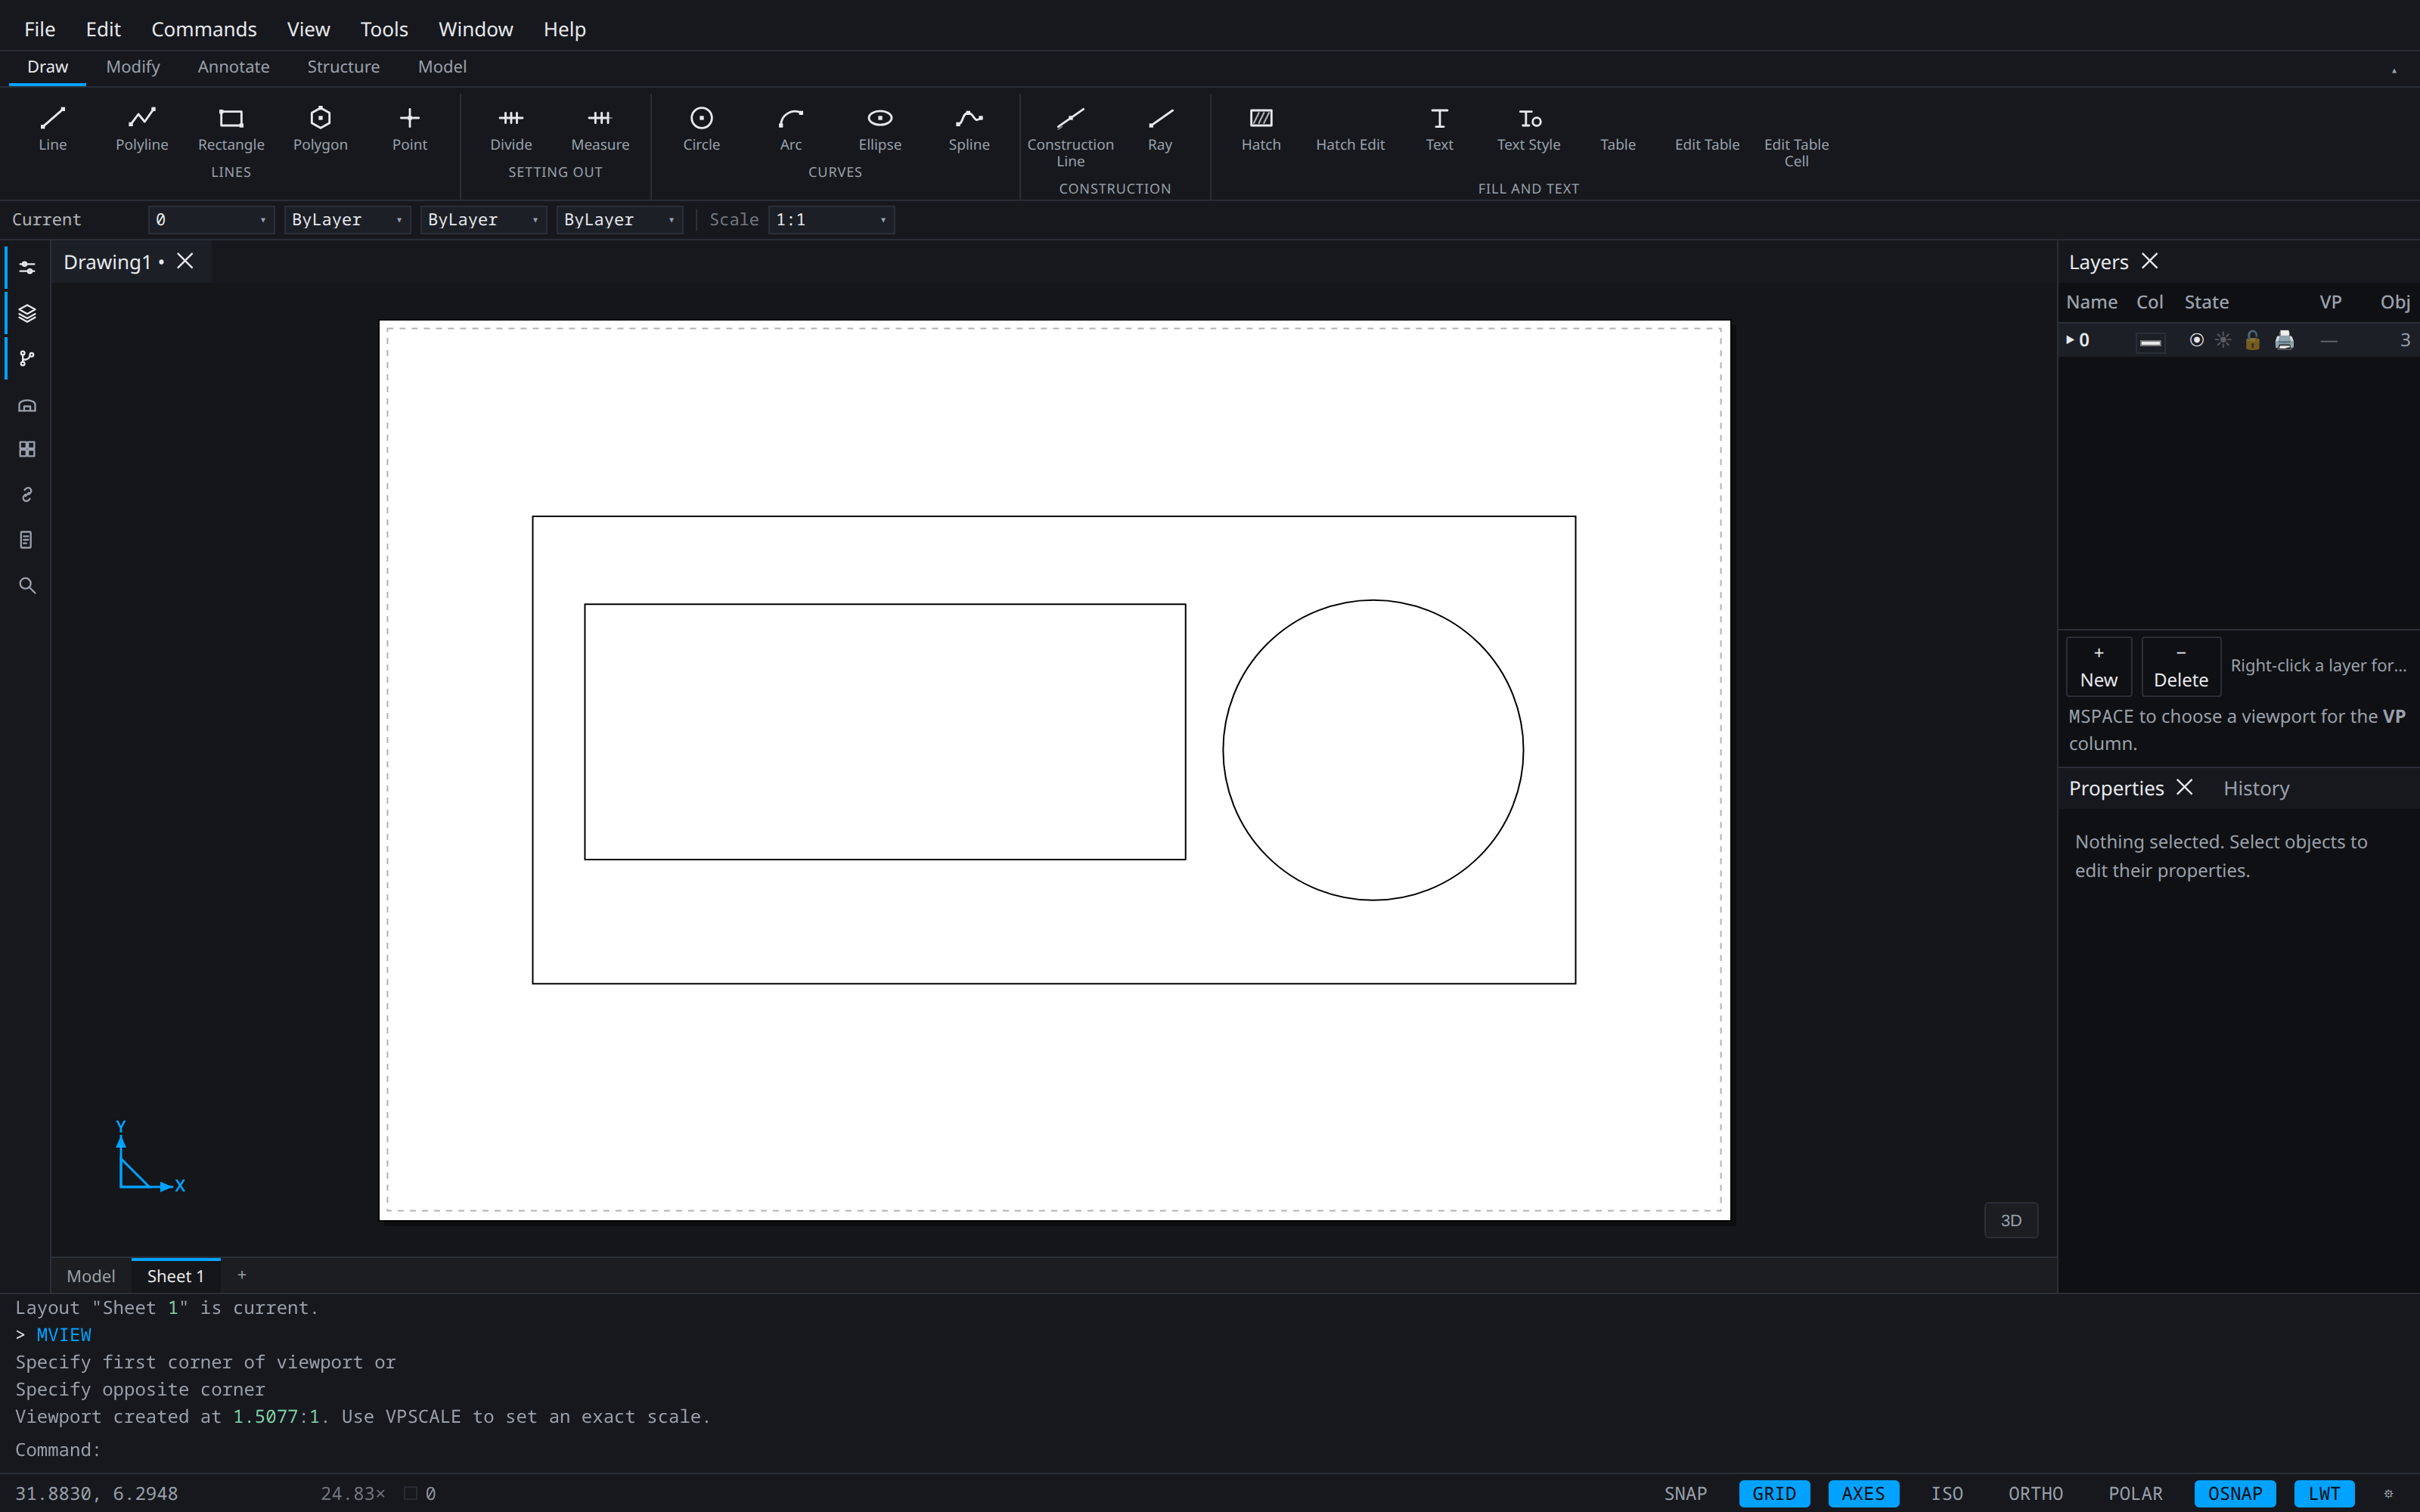
Note what the command line reports when the viewport lands: the scale it was created at, and the command that sets an exact one. A viewport dragged to fit is a starting point, not a scale you would dimension against.
Viewports#
Creating one. MVIEW draws a rectangular viewport. Boundaries may also be circular or arbitrary closed polylines: pick a closed loop and it becomes the viewport's shape, consumed in the process. A boundary needs a positive area, not merely three points.
Scale. A viewport's scale factor is set numerically or from the standard list. Everything inside it — geometry, lineweights, annotative text — resolves against that factor.
Activation. Double-clicking inside a viewport activates model space through that window: the display space and the edit space come apart, so you are editing the model while looking at the sheet. MS and PS do the same by command.
- Pan and zoom inside an active window re-aim that window — its target and its scale change, which is exactly what a drafter adjusting a detail means.
- A click outside the active window is ignored rather than passed to paper space, so an overshoot does not silently drop you back to the sheet.
- The grid under an active window is the model's grid, because that is the space you are editing.
- A viewport with a fixed view direction cannot be activated.
Locking. Locking a viewport freezes its scale and target so a stray zoom cannot rescale a detail that has already been dimensioned.
Per-viewport layer visibility. A layer can be frozen in one viewport and thawed in another, which is how one model serves a floor plan and a reflected ceiling plan on two sheets.
Page setup#
A page setup names the paper size, orientation, printable area, plot scale, plot offset, and the plot style table to use. Page setups are stored with the drawing and can be applied to any sheet, so an office standard is set once.
Plot style tables#
How an object looks on screen and how it plots are different questions, and a plot style table is the answer to the second. The canonical case: a drawing drafted in colour, so layers are distinguishable while working, that has to issue as black line work at controlled weights.
A plot style sets a property or defers to the object:
| Property | Values |
|---|---|
| Colour | A plotted colour, or use the object's |
| Screening | 0–100% of full ink. 100 is untouched; 0 plots nothing visible |
| Lineweight | A width in millimetres, or use the object's |
| Linetype | A named linetype, or use the object's |
| Plot | Whether objects using this style appear at all |
Assignment cascades exactly as colour does: a layer names the plot style its objects plot with; an object may name one of its own, overriding its layer's; anything unassigned takes the table's default.
That default is what makes the common case one setting rather than a per-layer sweep — a table whose default forces black is "plot this drawing in monochrome", and it needs no other entries.
Plotting#
A layout plots to PDF at its true paper size: sheet geometry at 1:1, and each viewport's model geometry transformed to its plot scale and clipped to its window.
- Lineweights plot as real stroke widths in points.
- A hatch's islands are cut as holes rather than filled over.
- Curves are flattened to a fixed distance on the paper, so a curve is smooth in the hand at any plot scale. The tolerance is a quarter of a point — about two dots on a 600 dpi printer — rather than a fraction of a drawing unit, so plotted curve quality does not depend on which unit somebody set months earlier.
The plot dialog offers a preview of the composed sheet before anything is written.
Draft plots to PDF and Amalgative Redline marks up PDF, so Draft → Redline is a supported workflow rather than a coincidence of file formats.